[Paper Review] Graph-Based Learning for Stock Movement Prediction with Textual and Relational Data
1. introduction
This paper makes 3 contributions to stock price predict
:
- learn both from text data and relational data
- incorporate an unlimited number of relational graphs into the structure
- take temporal patterns of the news into account instead of learning from only one news at a time.
2. problem formulation
- the paper formulates the stock movement prediction as a binary classification.
given a universe of stocks $S$, for s stock $s \in S$, he defines its return $r_s $ between $t$ and $t + \Delta t$ as : \(r_{s,t} = \frac{P_{s,t+\Delta t}}{P_{s,t}} - \frac{P_{m,t+\Delta t}}{P_{m,t}}\) $s$ is specific stock, $m$ is the market index.
with the $r$ above , we define classification problem, \(Y_{s,t} = \begin{cases} {1, ~r_{s,t}>0} \\ {0, ~r_{s,t}\leq 0} \end{cases}\)
- Traditional single stock movement prediction is described as, \(\hat{Y_{s,t}} = f({E_{s,t}}^T , \theta)\) where ${E_{s,t}}^T$ denotes all the news for stock $s$ between t-T and t and $ \theta$ denotes the trainable parameters
The authors suggests more elaborate prediction, \(\hat{Y_{s,t}} = f([{E_{1,t}}^T, {E_{2,t}}^T, \cdots ,{E_{n,t}}^T] ,[G_1 , \cdots ,G_g], \theta)\)
3. Multi-Graph Recurrent Network for Stock Forecasting
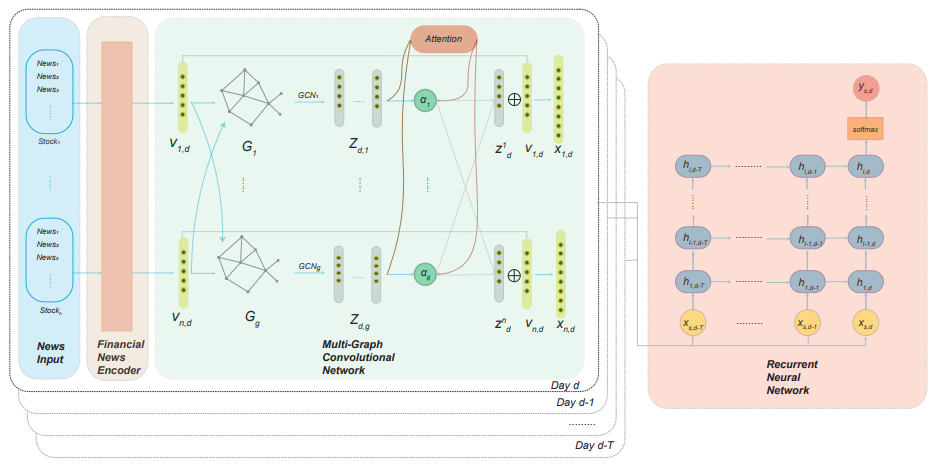
- Figure 1: An overview of the architecture of the MGRN model. Our MGRN model includes three sub-components:
- (1) Financial News Encoder, which encodes textual news into a fixed-length vector for each stock and each day ($v_{s,d}$).
- (2) Multi-Graph Convolutional Network, which takes the encoded daily news vectors and the graphs as input. Through this multi-graph structure, we get multiple node embeddings for each stock. We then combine these node embeddings into a single embedding ($\hat{x}_{s,d}$) through an attention mechanism.
- (3) Recurrent Neural Network, which takes the combined embeddings during a look-back window T as input and extracts temporal patterns among the news. $h_{i,j}$ denotes the $j$-th LSTM cell on the $i$-th layer. Finally, through a fully-connected layer, we predict whether the stock price increases or decreases ($\hat{y} _{s,d}$)
3.1. Financial News Encoder
-
Aggregated news embedding
graph-based network structure requires a valid node embedding for each node when we train and predict. Therefore, we need to choose a reasonable time window to make sure that for most of the stocks, there is at least one piece of news in this window. Otherwise,there will be too many zero embeddings. The author chose $s$ =1 as a window, though. Also, the author used the average of embedding on news $s$ , \(v_{s,d} = \frac{1}{n} \sum^{\mid {E^1}_{s,d} \mid }_{i=1} {e^i}_{s,t}\) Here, ${e^i}_{s,t}$ is the embedding of the $i$-th news about $s$ happening at time $t$ between $d$ and $d_1$
3.2. Multi-GCN Attention Network
-
Graph Representation
Let’s define $A \in R^{n \times n } $ as graph $G$’s adjacency matrix.
There are two kinds of relationships,
1) Boolean : 1 or 0, like sector graph 2) Continuous : like stock correlation.
Author applied technique to change the matrix into symmetric, \(\hat {A} = D^{- \frac{1}{2}} A D^{- \frac{1}{2}}\) , where D is a generalized diagonal node degree matrix, \(D_{i,j} = \begin{cases}\sum_k A_{i,k}, ~~if~~i=j \\ 0, ~~~~~~~otherwise \end{cases}\)
-
simple graph convolutional Network
for day $d$, he constructs a daily news matrix with $X_d$ = $[v_{1,d}, \cdots , v_{n,d}]^T$ and one graph $G$, its adjacency matrix $A$.
Therefore, GCN with L layers is written, \(H^{l+1} = \sigma ( \hat{A} H^{l} W^{l})\) where $H^0 = X_d$ and $H^L = Z_d$ as the final output. Here, $H^l \in \mathcal{R}^{n \times f_l}$ , $f_l$ denoting the number of output features for layer $l$. As a result, one can get a new node representation of dimension $f_L$ for each stock from $H^L$
-
Attention Aggregation Layer
giving $g$ graphs $G_1 , \cdots , G_g $ with $A_1, \cdots ,A_g $ , the author applied each graph an independent GCN. for day d, $g$ graphs $Z_{d,1}, \cdots , Z_{d,g}$ exists. Using the attention mechanism, the author got aggregated graph output.
define trainable parameters : $W_a \in \mathcal{R}^{f_L \times w}$ and $q \in \mathcal{R}^{w \times 1} $. Then, attention coefficients $\alpha_i \in \mathcal{R}^{n \times 1} $ for graph $i$ is, \(\alpha _i = \frac{exp(Z_{d,i}W_a q)}{\sum_j exp(Z_{d,j}W_a q)}\) Then, aggregate all the Z using, \(Z_d = \sum _i \alpha _i \otimes Z_d,i\) finally, concatenating daily news embeddings, the final output after the graph layer for the day $d$ is \(\hat{X_d} = X_d \otimes Z_d\) $\otimes$ is concatenation here.
3.3. Recurrent Neural Network
RNN is used to capture temporal patterns in the news.
from $d$ to $d-T$, get $ \hat{X}d, \cdots , \hat{X}{d-T} $
using T data, and implement a multi-layer recurrent neural network with LSTM cells.
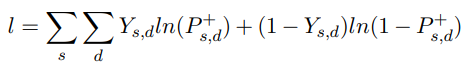
$P_{s,d} ^+$ is the estimated probability of price going up, and $Y_{s,d}$ is the true stock price movement defined before.
4. Experiments
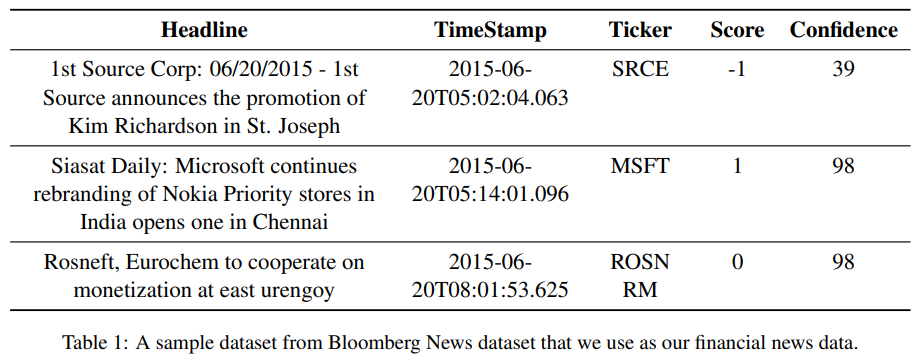
4.1. News data
The author used bloomberg data since bloomberg news serve some classification infromation.
Also, author removed the companies with too little news. (above average of 2 are only used)
4.2. Stock price dataset
Europe STOXX 600 index value
4.3. Graph data
- Stock Sector Data
- Supply Chain data
4.4. result
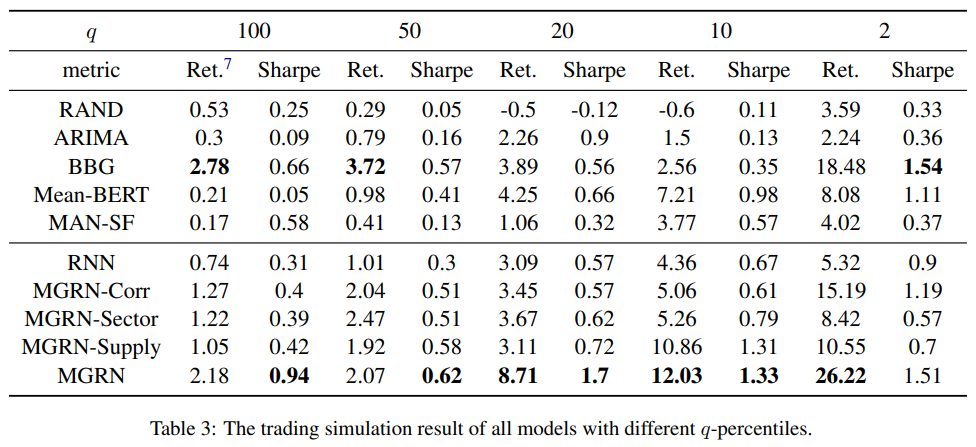
It show greatest scores
Leave a comment